Customize context menu in Nevron Diagram

Scenario:

I had a requirement for preventing user to edit the “Composite Shape” elements (e.g. Text Primitives, Ports etc.). This restriction is required during the development for most of the cases because programs are using these shapes for some special purpose representation and these should not be altered by the use at run time to keep them consistent.

If user change these shapes then it will be hard to know that it has been modified this diagram is saved as XML string in some data store. If shape elements are used to identify the shape elements by name then it will break the program for being consistent for these shapes. See the below image, If the edited port name is used in program to  identity the center port then it will be distinguish the center  port in all of these ports.

clip_image002[5]_thumb[1]

Finally, it is required to remove some commands from the context menu of the shape in the diagram view for the user so that user will not able to modify the shape elements.

Solution:

At first place, you need to use the “Protection” on the shape to prevent some operation. You can restrict few operation on the shape for the user.

clip_image003[9]_thumb[1]

These can be set programmatically, these are just for making restrictions on the shape not for the context menu operations. See below code example:

NAbilities shapeAbilities = new NAbilities();
shapeAbilities.All = false;
shapeAbilities.InplaceEdit = true;
shapeAbilities.ResizeX = true;
shapeAbilities.ResizeY = true;
shapeAbilities.Export = false;
NShape shape = (NShape)nDrawingDocument1.ActiveLayer.Children(null)[0];
shape.Protection = shapeAbilities;

Real Solution
The simplest solution is that create a custom context menu builder for creating context menu for the current diagram view.  This will create/add the required command that you want to provide to the user while working in the diagram.

First create a Custom ContextMenuBuilder by inheriting “NDiagramContextMenuBuilder” class and override “BuildContextMenu” method. There you need to create the context menu and add the required commands to the created context menu.

internal class CustomContextMenuBuilder : NDiagramContextMenuBuilder
{
    public override NContextMenu BuildContextMenu(object obj)
    {
        NContextMenu contextMenu = new NContextMenu();
        contextMenu.Commands.Add(CreateCommand((int)DiagramCommand.Delete, false));

        return contextMenu;
    }
}

After that create an instance of this custom context menu builder and assign it to the ContextMenuBuilder property of your diagram command bars manager:

nDiagramCommandBarsManager1.ContextMenuBuilder = new CustomContextMenuBuilder();

Create and preview website page using Visual Studio Code

Today is the first day when i have used Visual Studio code after uninstalling the Bracket. Bracket has nice feature live preview to run the html document in the browser. I was expecting the same in Visual Studio code but it took me half an hour to figure that how to run the html from VSCode. VSCode use Node.js for most of the work to be done.
Finally i have figure out that how to start a small project, containing only a single HTML file in VSCode and edit it with preview in a browser similar to live preview feature in Bracket. I have all my tools setup to start creating my first project in VSCode but if you are not installed VSCode and Node.js then download VSCode and Node.js.  You can find little bit information to install Node.js here.
After you have done installation of the Node.js, either you need to setup the PATH variables in windows or the setup automatically done this work for you. You can verify this by typing below command on command prompt that Node package manager is globally accessible or not:
npm -v

Now it the right time to setup the webserver. Run the below command on the command prompt:
npm install -g live-server

image_thumb[3][9]

Now create a html file in VSCode configured folder.

image_thumb[6][9]

To preview the html document, run the below command at the project folder.

live-server


image_thumb[10][9]

It is also possible to see the live preview in VSCode split windows. You have follow below steps to do this:

  1. Create a live-view.md file with this in it (Place it wherever you want. I put it at the base folder of all my projects since I can use it for whatever I'm currently working on):
    <div style="border:1px solid #777;
    position:absolute;left:10px;top:10px;bottom:10px;right:10px;"> 
      <iframe src="http://localhost:8080/"; width="100%" height="100%" frameborder="0" /> 
    </div>
    
  2. Open live-view.md in the second/split pane in VS Code and click the "Open preview" button (top right of file).
Happy coding.

Run CSharp “Hello World!” program on Developer Command prompt

To start writing your first program without using the Visual Studio or other tools, you just need to open “Command Prompt”. Just type command on the search in Start menu either you are using Windows 7 or any higher.

image_thumb[10]_thumb[3][4]

Visual Studio installs few command line tools to do some operation using command tools and these can be invoked using the “Developer Command Prompt for VS2015”(For Visual Studio 2015). If someone has not installed Visual Studio then just install .NET Framework on the computer.

After this we are ready to create and compile our “Hello World!” program using the .NET Framework compilers.

Now create a file “hello.cs” using the “notepad”. We are going to write our code to print “Hello World!” on the screen for this example. “.cs” is the common extension for the C# file and “.vb” for Visual Basic. So now we going to create a C# program now so this file will contain C# code.

image_thumb[16]_thumb[1][4]

After running this command a prompt will appear with message “Do you want to create a new file?”. Click on “Yes” to create a new file.

In this we are going to create a class with a static method “Main”. In a Console application that would run on command prompt, CLR look for class named “Program” with a “Main” method to run the program.

image_thumb[8][3]

Now save this file and come back to the command prompt.

Now one of the tool “csc.exe” exists in the “Windows” directory in the .NET framework installation paths. It can be located at the path “C:\Windows\Microsoft.NET\Framework\{.NET Framework}”. Under the Framework folder you will find installation of .NET Framework multiple version. Below is the path of the latest one on my system. It is the “Visual C# Command Line Compiler” which compiles the C# code.

image_thumb[24][4]

Now we are going to compile the C# code then execute the program. After compiling the program C# compiler produce a executable file(.exe).

To compile the created C# code file, use the below command line on command prompt. Just pass the created “hello.cs” as parameter.

  1. csc hello.cs

image_thumb[29][4]

On windows we can run exe. Now run the hello.exe to view the result of our example program.

image_thumb[32][4]

That’s all done. We have created an example program run on the command prompt using the C# command line compiler.

Actually it transforms C# code into Microsoft Intermediate Language. This can either an exe or dynamic link library. We specify the assembly format to the csc.exe using the /target:library option. See below image for various target options:

image_thumb[37][4]

  Happy Coding!

Configuring Orchard CMS blog in Open Live Writer

After using Windows Live Writer, now I have start using Open Live Writer to do remote blogging. Right now WLW is not able to connect with few blogging platforms like blogger.com and also Microsoft has stopped putting efforts on the amazing tool for the bloggers.

OLW is an open source tool which is developed by the contribution of the developer community. Lots of features of this tool is under development. It has the main advantage that there are many tools available as compare to the HTML editor on the remote blog. You can work offline, which might be good if you’re in a situation where you don’t have a decent internet connection or not able to connect to internet for days. It will let you write blog posts and save them to draft for later publishing.

In this article, you will go through the steps to configure Open Live Writer for the Orchard CMS. This provide support for remote bloging through XmlRcp. Both WLW and OLW are able to connect with the Orchard CMS blog using this feature.

Orchard provides this XML-RPC feature out of the box and You have to enable it in the Modules section inside your Orchard CMS Orchard admin panel.

Prerequisites:

  1. You have setup Orchard CMS on your web hosting or local IIS and created a blog on website.
  2. Installed OLW on your computer.

If you have done pre work then go to the Administration Dashboard of Orchard and click the Modules. There you will find Remote Blog Publishing feature under the Content Publishing section. It is dependent on XmlRpc so if you enable it then XmlRpc feature will automatically enabled.
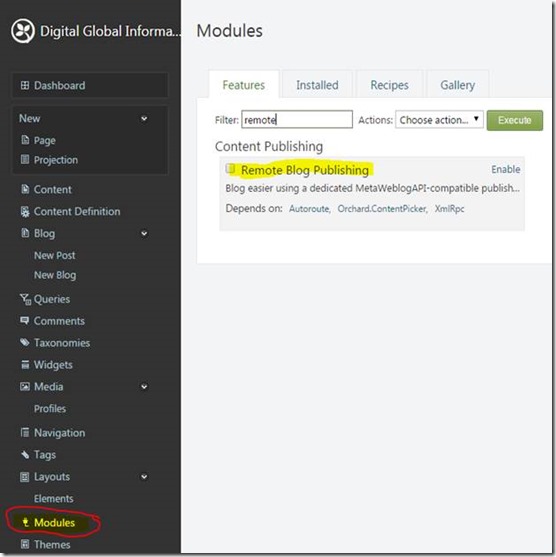
clip_image002

To enable Remote Blog Publishing click the Enable link. After clicking the enable link you will see both of them enabled at once since they are dependent features. After you click Enable, if everything is Ok then you will see following message:

clip_image004

After enabling these modules you are ready to configure Orchard blog in Open Live Writer. Now, launch Live Writer from your Start menu in Windows.

In Blog Accounts section, click on 'Add blog account'
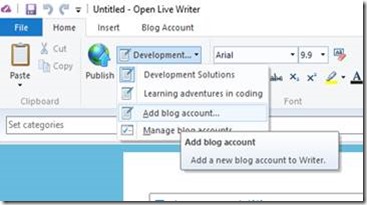
clip_image006


When you choose “Add blog account” then you will see below prompt to select the blog service. Choose “Other blog service” from the available options and click Next.
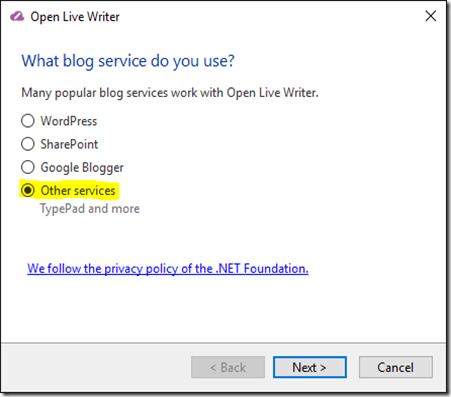
clip_image007

Type the URL to your Orchard blog, along with the admin user name and password that you defined when you set-up Orchard for the first time.
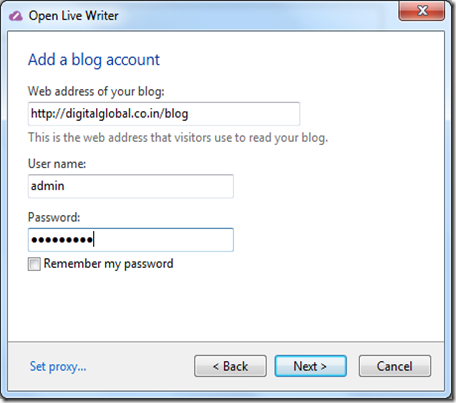
clip_image008

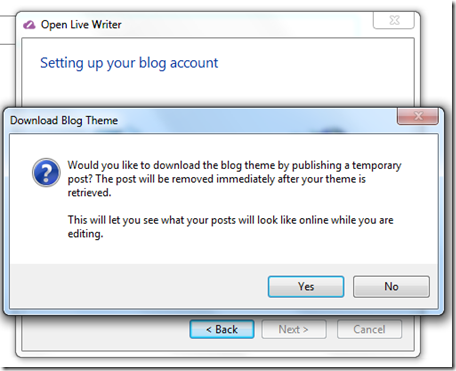
Click Next. Open Live Writer will connect to your blog in order to read the XML-RPC capabilities that Orchard supports and download the current Theme (for previewing posts before publishing). If you are prompted to create a temporary post during this step, select "Yes" in the dialog.
clip_image009

After that it will complete downloading supporting files and template for making blog post writing intuitive.

clip_image010

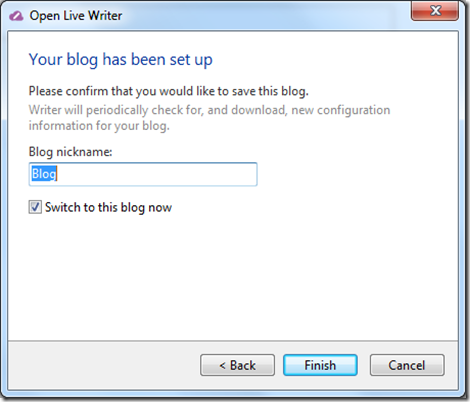
Once it finishes, you will have window where you can specify the name of your blog you have just configured in Open Live Writer, click Finish.
clip_image011

Now you are ready to write blog post for your Orchard CMS blog.

Prevent minification to manipulate Angular JS controller parameters

In AngularJS controller can have $scope or $http parameters. These must be $scope or $http rather than s or h. Minification process removes extra spaces and convert JavaScript method parameters to single character so that it tries to convert them in single character parameters.

When we declare a controller using the module then most of us just simply specify the controller method as below:

var app = angular.module("githubViewer", []);
//Controller
var MainController = function($scope, $http) {
};

app.controller("MainController", MainController); //MainController is controller method

During the learning, I get to know that during the minification process these parameters are changes to some single character. If these are renamed then AngularJS will not able to find the $scope and $http parameter. It expect them as 6 character $scope and 5 character $http in the controller method. To avoid this happen you need manually specify the parameters name when you specify the controller name and controller method to the module.

app.controller("MainController", ["$scope", "$http", MainController]);

       Hope this help someone to avoid making this mistake..

“Object reference not set to an instance of an object” after install of Visual Studio 2015 Update 3.

Yesterday I have installed update 3 for Visual Studio  2015 Community edition. At that time set failed due to internet disconnection during the installation. Somehow setup completed but when Visual studio was not working correctly. It was showing “Object reference not set to an instance of an object” when try to select any item in visual studio as shown below:

image_thumb[1][3]

Solution
To resolve this issue I have tried to repair the Visual Studio using Program and Features in Control Panel but still the situation is same. After doing some research I found that it is the issue with the configuration setting and common files for the visual studio located at following locations:

  1. C:\Users\{user}\AppData\Local\Microsoft\VisualStudio
  2. C:\Users\{user}\AppData\Local\Microsoft\VSCommon

Delete the content from these folders. If you do this way then all of your user settings such as Visual Studio layout, linked Microsoft account or start page settings get lost.

If you have installed multiple version of the Visual Studio then it is sufficient do delete folder ComponentModelCache on path
C:\Users\{user}\AppData\Local\Microsoft\VisualStudio\{version - 14 or 12}. It will preserve other setting of the Visual Studio. If it does not work then delete all content from the “Visual Studio” folder.

Some times it require to run “devenv /resetuserdata” command to reset the user data of the visual studio. I did it also using the Developer Command Prompt for Visual Studio Console but you can find this command tool at following locations:

  1. [x64] C:\Program Files (x86)\Microsoft Visual Studio 14.0\Common7\IDE
  2. [x86] C:\Program Files\Microsoft Visual Studio 14.0\Common7\IDE

image_thumb[3][3]

Hope it will save time for someone rather doing uninstall or install for Visual Studio again.

New feature “Add a reference to a NuGet package” in Visual Studio 2015 Update 3

Microsoft announced the release of Visual Studio 2015 Update 3 two days ago. They have addressed issues from previous update and improved few things. In the list of improvements, I found an interesting thing that you can now quickly include NuGet packages by just using the resolve reference method. You can say it An option to add a reference to a NuGet package as a quick fix.
nugetbulb_thumb[1]

You can enable this option from Tools > Options > Text Editor > C# > Advanced, under "Using Directives":

nuget_thumb[1]

Visual Studio is improving in most of the expects for the development of the Universal Application development. There kind of improvements can make you more productive..

How to solve roslyn compiler issue on shared hosting?

Scenario:
I have created a web application using Visual Studio 2015 and .NET 4.6. When I have compiled and uploaded my project files to the hosting server, it showed the exception of related to permission. After checking for a while I found that application is trying to execute the CSC.exe file within the Bin\roslyn\ folder, but IIS user account does not permission to do that.

Solution:
If you are trying to publish Roslyn on shared hosting then you should know that it runs on Full Trust mode. Shared hosting companies does not allow Full Trust applications automatically , they override this globally with Medium Trust due to security restrictions as they are hosting multiple customers website and they don’t want one application affects another by any chance. Some hosting provider provide you the control to run your application on Full trust and provide setting to do that in these days.

Roslyn compilation will only work with Full Trust so on some shared hosting you might face challenges. I would suggest ask your hosting provider if they support Full Trust mode or not.

If shared hosting does not support Full Trust you should not deploy application with Roslyn, this will display you some sort of .exe file missing errors. Even you can’t upload .exe files to FTP on shared server, but you can somehow able to upload these exe files through their control using the zip package and then unzip on the hosting folder.

Below are the steps to deploy without Roslyn:

  1. Open NuGet Package Manager from tools menu or Use Manage NuGet Packages for Solution it will give you graphical way to uninstall packages from the solution project in which you are using that package.

    clip_image002_thumb[1]
  2. Now uninstall Microsoft.CodeDom.Providers.DotNetCompilerPlatform package using the below command line in Package Manager console:

    Uninstall-package Microsoft.CodeDom.Providers.DotNetCompilerPlatform <Your Web project name>

    clip_image004_thumb[2]
  3. Now rebuild & republish. This uninstallation also removes CodeDom configuration from web.config file. This will solve your purpose. Basically this will not generate any csc.exe, vbc.exe files inside bin folder of your project.

    In your web project publish profile settings, uncheck "Allow precompiled site to be updatable". You can find this under Settings > Precompile during publishing > configure.

    clip_image005_thumb[3]

Solution from - Roslyn CSC.exe, Web API 2 on Hosting Server
Hope this help others to solve the issue.
Cheers!

Analyzing the Quality of your code with NDepend

Throughout my carrier I have worked on various projects in different environment. Few of them are completed solo and few are with small or big teams. As per my opinion and learning till now “Writing a good and clean code is an art”. This is improved with experience and learning about the “Design Patterns”.

When you are doing project as one man army then you are good to write better code and refactor it maximum as per your understanding and knowledge, but when it done with in a large project and team then a project manager or Architect will definitely worry about the quality and success of the project.

In starting days of my carrier, One day my manager asked me to learn about the Cohesion and Coupling. I was not able to understand it much at that time and tried so many time to implement it in my coding practices. After continuously taking care of such factors and knowing about the “Design Patterns” e.g. SOLID, FAÇADE etc. what I have realized that all of these things redirect the programmers to make “Quality Code”.

After this when it comes to manage a big project then you require some tools which help to find issues in a large project. It makes an architect to keep free from these below question for some instance:

  • Is the code looking good?
  • What about its complexity and test coverage?
  • Can you consider the code as maintainable with a good scalability?
  • Are there instances of copy and paste code smells?
  • How loosely and tightly coupled is the architecture? (In terms of cohesion and coupling etc.)

Doing this task manually is a time consuming process because checking and running every module will definitely consume some time. Without running the project it is possible in manually compiling and inspecting but with the tools it is much time saving process.

To check the quality of the code and analyze, I put my hands on Visual Studio inbuilt tools e.g. Unit Test Runner, Code Metrics, and Static Code Analyzes. These tools are good to work but there are few third party tools available to do some task with high precision analyzes e.g. FxCop, JustCode, ReSharper, and NDepend.

In this article, I am going to explorer the features and benefits of NDepend.


What is NDepend and its use??

NDepend is a static code analyzes for .NET. NDepend can be used in both standalone and Visual Studio integrated mode (Through Visual Studio extension). This nice tool is create by Patrick Smacchia for the developer community.

NDepend Visual Studio extension performs a range of analyzes across a solution, either during design time or retrospectively across an existing project. Current version of NDepend 6 provides 82 Code Metrics which are analyzed and reported on by the tool either in GUI or html format.

Right now I have used it in Visual Studio Integration mode. I prefer to use in integrated environment rather than doing application switch for doing same thing in different window and NDepend provide most of its functionality in Visual Studio while working with the project through a separate menu.

clip_image001

Setting NDepend Integration with Visual Studio:

To enable work NDepend in Visual Studio, NDepend guys provides an extension installer “NDepend.VisualStudioExtension.Installer.exe”. Check highlighted file in the below image.

clip_image002

Once you run this extension installer it will pop up an installation dialog which let us to integrate NDepend in our desired version of Visual Studio. Right now I am using Visual Studio 2015, so I installed for my IDE.

clip_image003[6]

After completing installation, you can access to various metrics, rules, graph, reports, analyzer results and tools at one place to analyze the project for different aspect of the quality measures.

NDepend is mainly a static analyzes tool and more. It provide out of the box rule and customizability of rule through CQLinq, Visual Dependency representation, Build Integration and Change tracking. NDepend allow us to write own custom rules and you can visualize your code base and its dependencies with series of matrices and graphs as well.

It does more than providing snapshot of the code base at moment some times. It integrates in to Build process and allows us to monitor the evolution of the code and decide whether you making progress towards quality or not.

Start analyzing my first project with NDepend

After installing NDepend in Visual Studio, I found it very user friendly and quite intuitive. You can just select project from the NDepend menu to start analyzing it. Let see how its start screen looks like in first glance.

clip_image004

Here you can select specific menu to start working with NDepend. Now my solution is open so I am just going attach a new NDepend project to current solution. Just click on the circle in status bar of the Visual Studio and you have access to NDepend here also. See below image.

clip_image005

Now select “Attach new NDepend project to current VS Solution”. Now it prompt to select the assembly to analyze and you can also add another assemblies on below screen.

clip_image006[6]

Just click on “Analyze a single .NET Assembly”. Now it start analyzing the assembly and after completion of process it will pop up a dialog and along this generates html report about the analyze results.

clip_image007

I am going to click on the View NDepend Dashboard and it redirected me to dashboard.

clip_image008[6]

  And html generated report is shown as below:

clip_image009

In Visual Studio, there are lots of windows available through NDepend to analyze quality of the code base and even you can customize these. I am going through main features of the NDepend one by one. See below screen shot with Queries and Rules Explorer, Dependency Graph and Queries editor. 

clip_image010[6]

Code Rule and Code Query over LINQ (CQLinq)

NDepend project provides build-in metrics when you create a new project to analyze an assembly. As I saw in Queries and Rules Explorer, there are more than 200 default project rules and their queries.

These rules are made up using the CQLinq. CQLinq is default scripting for NDepend to create rule queries. So in this way you can create our own queries and customize them too. CQLinq editor provides code completion and intellisense with live error description.

clip_image011

Dependency Matrix

Dependency Matrix shows dependency and coupling between the projects and their module. NDepend must responsive and easy navigate through the dependencies between the projects. When you click on any cell then it shows graph and information in tooltip manner. I liked this behavior because I do not need to switch between dependency graph and dependency matrix. They are shown in a synchronized way and easy to visualize and analyze the results.

clip_image012[6]

Dependency Graph

It is an interactive way to represent coupling between the code base elements. Actually NDepend provide this graph for various code exploration scenarios. You can find full description about these in documentation - Exploring Existing Code Architecture in Visual Studio through Dependency Graph.

  • Dependency Graph
  • Call Graph
  • Class Inheritance Graph
  • Coupling Graph
  • Path Graph
  • All Paths Graph
  • Cycle Graph

These various type of graphs are accessible from NDepend->Graph menu items.

clip_image013

clip_image014[6]

Code Metrics View

Code metrics view represents tree-structured data in rectangular blocks format.

clip_image015

Continuous Integration Reporting

These feature matter much analyzing a huge code base. Along with CQLinq, I like NDepend for this feature. NDepend integrate with TFS, Team city etc. in build process to check for the violation of CQLinq rules continuously and these are reported to the development teams to improve the code.

NDepend can analyze source code and .NET assemblies through NDepend.Console.exe. Each time it analyzes a code base, NDepend yields a report that can inform you about the status of our development. As I described in the starting of article about the html document which generated during the analyzing process is generated during build process.

This exe is located in the installation folder and the file name is “NDepend.Console.exe”. It is integrated in the building process by specifying command line arguments.

Conclusion

These are the few features which I have used so far but NDepend is loaded with lots features. In my opinion NDepend is light weight, powerful and intuitive application. Customization with the rules and metrics is an additional advantage using its best part CQLinq. It also integrate with Reflector and other tools which improves the productivity. I found it much better tool for maintaining quality of the application so far. Hope NDepend will continue improving this tool in future and let development process to improvise in easy way.

Task.WaitAll freezes UI with Control.Invoke() method.

Parallel tasks are important to complete the independent operation simultaneously. It makes us completely very heavy and time taking processes in less time when these operations run in multi-core environment but we have to follow the rules to make this multi-tasking to work.

Today I experienced such a case where my written code put me in a condition of “Dead Lock”. It is a situation more than one task that want to acquire the same resource and one is already holding this resource but another also wants to access it. If no task able to complete its operation then it creates a deadlock situation.

When we creating application, in some cases it may be possible to update the UI in various threads. E.g. Progress reporting. I found a case that let our application put into a situation which freezes the application. Let there was few tasks that are independent of each other but we need to merge the result all of these tasks with some required condition.

List<Task> tasks = new List<Task>();
//Create and start independent tasks
tasks.Add(Task.Factory.StartNew<List<string>>(() => CreateInitialData()));
tasks.Add(Task.Factory.StartNew<List<string>>(() => CreateValidationData()));
tasks.Add(Task.Factory.StartNew<List<string>>(() => CreateGUILookup()));

Now we need to complete these tasks to get the results so that we can merge it. To do this, the Task Parallel Library has Task.WaitAll method which takes array of task as a parameter. It waits until all the operations do not complete. In other words, it hold the UI and waits to complete all the tasks.

Task.WaitAll(tasks.ToArray());
//Merge result of all task on completion

In one of the thread, some subtask is done which make a call to the UI. It was working fine for a while until I made some changes. I was trying to get one property of the progress bar and it was accessed in an asynchronous way using the “BeginInvoke” method. It was a bug in the application which does not return the correct results so I replace it with the “Invoke” method.

“Control.Invoke()” method waits and returns the results immediately while BeginInvoke method is an asynchronous approach. It leaves control from the current statement without returning the values and we are not able to get returned results until we call AsynResult.EndInvoke().

//At some instance code by mistake try to access 
// the properties of the any control and made dead lock
// 
int progress = (int)this.Invoke((Func<int>)delegate 
{ return progressBar1.Value; });
System.Diagnostics.Debug.Write(progress);

Now what WaitAll does, it blocks until all tasks have finished. The tasks can't finish because Invoke will run its action on the UI thread, which is already blocked by WaitAll. It is creating deadlock because Invoke waits for the UI thread to unblock.

Complete example:

namespace ParallelWaitDeadLock
{
    public partial class Form1 : Form
    {
        public Form1()
        {
            InitializeComponent();
        }
 
        private void button1_Click(object sender, EventArgs e)
        {
            List<Task> tasks = new List<Task>();
            //Create and start indepenet tasks
            tasks.Add(Task.Factory.StartNew<List<string>>(() => CreateInitialData()));
            tasks.Add(Task.Factory.StartNew<List<string>>(() => CreateValidationData()));
            tasks.Add(Task.Factory.StartNew<List<string>>(() => CreateGUILookup()));
 
            Task.WaitAll(tasks.ToArray());
            //Merge result of all task on completion
       
        }
 
        private List<string> CreateInitialData()
        {
            //
            Task.Delay(1000);
            return new List<string>();
        }
 
        private List<string> CreateGUILookup()
        {
            //
            Task.Delay(1000);
            //At some instance code by mistake try to access 
            // the properties of the any control and made dead lock
            // 
            int progress = (int)this.Invoke((Func<int>)delegate 
            { return progressBar1.Value; });
            System.Diagnostics.Debug.Write(progress);
            return new List<string>();
        }
 
        private List<string> CreateValidationData()
        {
            //
            Task.Delay(1000);
            return new List<string>();
        }
    }
}

We need to take care to avoid such a situation when subtask tries to do UI relation operations even the parent task holds the UI and waits to complete the task.

It is causing a deadlock. The UI thread is waiting for the all tasks to be completed. UI resources are already locked by the Task.WaitAll and then we are trying to invoke code on the UI thread which is causing "Deadlock".

Task.WhenAll() method will return a new task that will be marked as completed when all tasks have completed. If we await this task, UI thread will be freed, and so the routine will be able to invoke code on the UI thread, avoiding a deadlock.

We should use Task.WhenAll() instead.  

await Task.WhenAll(tasks.ToArray());