How to solve roslyn compiler issue on shared hosting?

Scenario:
I have created a web application using Visual Studio 2015 and .NET 4.6. When I have compiled and uploaded my project files to the hosting server, it showed the exception of related to permission. After checking for a while I found that application is trying to execute the CSC.exe file within the Bin\roslyn\ folder, but IIS user account does not permission to do that.

Solution:
If you are trying to publish Roslyn on shared hosting then you should know that it runs on Full Trust mode. Shared hosting companies does not allow Full Trust applications automatically , they override this globally with Medium Trust due to security restrictions as they are hosting multiple customers website and they don’t want one application affects another by any chance. Some hosting provider provide you the control to run your application on Full trust and provide setting to do that in these days.

Roslyn compilation will only work with Full Trust so on some shared hosting you might face challenges. I would suggest ask your hosting provider if they support Full Trust mode or not.

If shared hosting does not support Full Trust you should not deploy application with Roslyn, this will display you some sort of .exe file missing errors. Even you can’t upload .exe files to FTP on shared server, but you can somehow able to upload these exe files through their control using the zip package and then unzip on the hosting folder.

Below are the steps to deploy without Roslyn:

  1. Open NuGet Package Manager from tools menu or Use Manage NuGet Packages for Solution it will give you graphical way to uninstall packages from the solution project in which you are using that package.

    clip_image002_thumb[1]
  2. Now uninstall Microsoft.CodeDom.Providers.DotNetCompilerPlatform package using the below command line in Package Manager console:

    Uninstall-package Microsoft.CodeDom.Providers.DotNetCompilerPlatform <Your Web project name>

    clip_image004_thumb[2]
  3. Now rebuild & republish. This uninstallation also removes CodeDom configuration from web.config file. This will solve your purpose. Basically this will not generate any csc.exe, vbc.exe files inside bin folder of your project.

    In your web project publish profile settings, uncheck "Allow precompiled site to be updatable". You can find this under Settings > Precompile during publishing > configure.

    clip_image005_thumb[3]

Solution from - Roslyn CSC.exe, Web API 2 on Hosting Server
Hope this help others to solve the issue.
Cheers!

Analyzing the Quality of your code with NDepend

Throughout my carrier I have worked on various projects in different environment. Few of them are completed solo and few are with small or big teams. As per my opinion and learning till now “Writing a good and clean code is an art”. This is improved with experience and learning about the “Design Patterns”.

When you are doing project as one man army then you are good to write better code and refactor it maximum as per your understanding and knowledge, but when it done with in a large project and team then a project manager or Architect will definitely worry about the quality and success of the project.

In starting days of my carrier, One day my manager asked me to learn about the Cohesion and Coupling. I was not able to understand it much at that time and tried so many time to implement it in my coding practices. After continuously taking care of such factors and knowing about the “Design Patterns” e.g. SOLID, FAÇADE etc. what I have realized that all of these things redirect the programmers to make “Quality Code”.

After this when it comes to manage a big project then you require some tools which help to find issues in a large project. It makes an architect to keep free from these below question for some instance:

  • Is the code looking good?
  • What about its complexity and test coverage?
  • Can you consider the code as maintainable with a good scalability?
  • Are there instances of copy and paste code smells?
  • How loosely and tightly coupled is the architecture? (In terms of cohesion and coupling etc.)

Doing this task manually is a time consuming process because checking and running every module will definitely consume some time. Without running the project it is possible in manually compiling and inspecting but with the tools it is much time saving process.

To check the quality of the code and analyze, I put my hands on Visual Studio inbuilt tools e.g. Unit Test Runner, Code Metrics, and Static Code Analyzes. These tools are good to work but there are few third party tools available to do some task with high precision analyzes e.g. FxCop, JustCode, ReSharper, and NDepend.

In this article, I am going to explorer the features and benefits of NDepend.


What is NDepend and its use??

NDepend is a static code analyzes for .NET. NDepend can be used in both standalone and Visual Studio integrated mode (Through Visual Studio extension). This nice tool is create by Patrick Smacchia for the developer community.

NDepend Visual Studio extension performs a range of analyzes across a solution, either during design time or retrospectively across an existing project. Current version of NDepend 6 provides 82 Code Metrics which are analyzed and reported on by the tool either in GUI or html format.

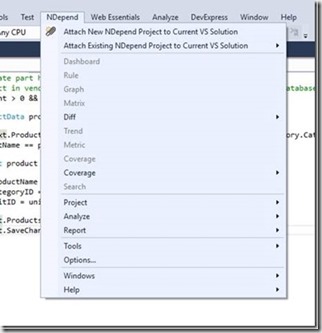
Right now I have used it in Visual Studio Integration mode. I prefer to use in integrated environment rather than doing application switch for doing same thing in different window and NDepend provide most of its functionality in Visual Studio while working with the project through a separate menu.
clip_image001

Setting NDepend Integration with Visual Studio:

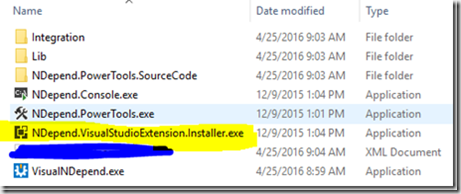
To enable work NDepend in Visual Studio, NDepend guys provides an extension installer “NDepend.VisualStudioExtension.Installer.exe”. Check highlighted file in the below image.
clip_image002

Once you run this extension installer it will pop up an installation dialog which let us to integrate NDepend in our desired version of Visual Studio. Right now I am using Visual Studio 2015, so I installed for my IDE.

clip_image003[6]

After completing installation, you can access to various metrics, rules, graph, reports, analyzer results and tools at one place to analyze the project for different aspect of the quality measures.

NDepend is mainly a static analyzes tool and more. It provide out of the box rule and customizability of rule through CQLinq, Visual Dependency representation, Build Integration and Change tracking. NDepend allow us to write own custom rules and you can visualize your code base and its dependencies with series of matrices and graphs as well.

It does more than providing snapshot of the code base at moment some times. It integrates in to Build process and allows us to monitor the evolution of the code and decide whether you making progress towards quality or not.

Start analyzing my first project with NDepend

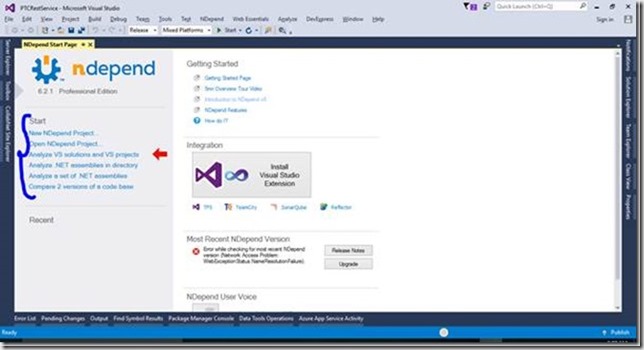
After installing NDepend in Visual Studio, I found it very user friendly and quite intuitive. You can just select project from the NDepend menu to start analyzing it. Let see how its start screen looks like in first glance.
clip_image004

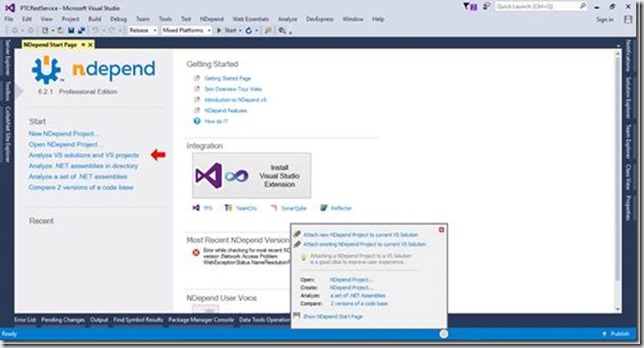
Here you can select specific menu to start working with NDepend. Now my solution is open so I am just going attach a new NDepend project to current solution. Just click on the circle in status bar of the Visual Studio and you have access to NDepend here also. See below image.
clip_image005

Now select “Attach new NDepend project to current VS Solution”. Now it prompt to select the assembly to analyze and you can also add another assemblies on below screen.

clip_image006[6]

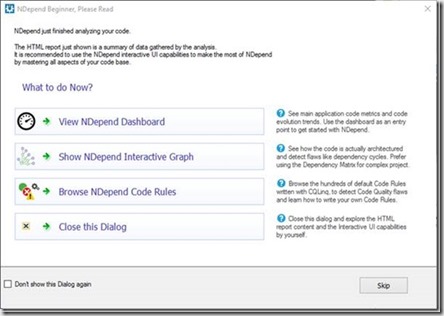
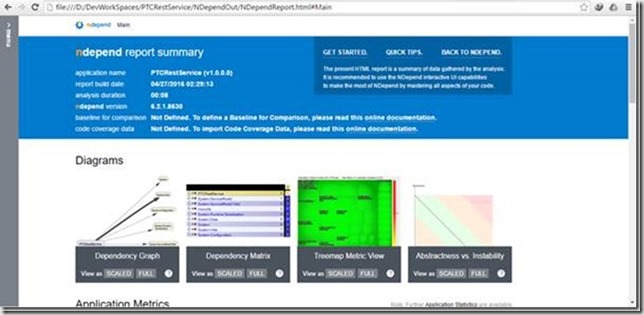
Just click on “Analyze a single .NET Assembly”. Now it start analyzing the assembly and after completion of process it will pop up a dialog and along this generates html report about the analyze results.
clip_image007

I am going to click on the View NDepend Dashboard and it redirected me to dashboard.

clip_image008[6]

  And html generated report is shown as below:
clip_image009

In Visual Studio, there are lots of windows available through NDepend to analyze quality of the code base and even you can customize these. I am going through main features of the NDepend one by one. See below screen shot with Queries and Rules Explorer, Dependency Graph and Queries editor. 

clip_image010[6]

Code Rule and Code Query over LINQ (CQLinq)

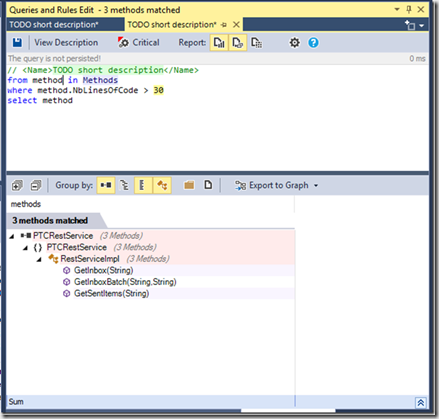
NDepend project provides build-in metrics when you create a new project to analyze an assembly. As I saw in Queries and Rules Explorer, there are more than 200 default project rules and their queries.

These rules are made up using the CQLinq. CQLinq is default scripting for NDepend to create rule queries. So in this way you can create our own queries and customize them too. CQLinq editor provides code completion and intellisense with live error description.
clip_image011

Dependency Matrix

Dependency Matrix shows dependency and coupling between the projects and their module. NDepend must responsive and easy navigate through the dependencies between the projects. When you click on any cell then it shows graph and information in tooltip manner. I liked this behavior because I do not need to switch between dependency graph and dependency matrix. They are shown in a synchronized way and easy to visualize and analyze the results.

clip_image012[6]

Dependency Graph

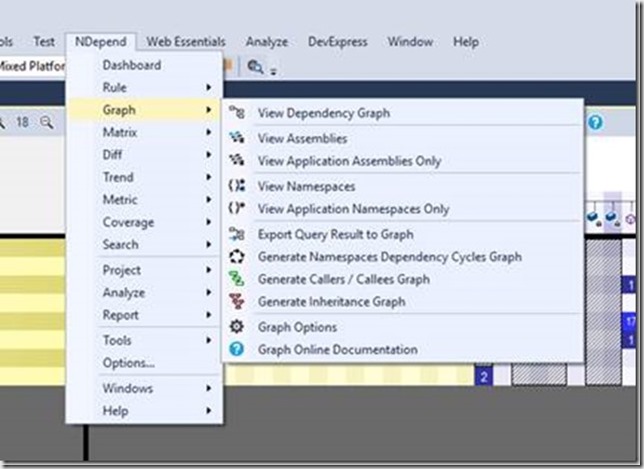
It is an interactive way to represent coupling between the code base elements. Actually NDepend provide this graph for various code exploration scenarios. You can find full description about these in documentation - Exploring Existing Code Architecture in Visual Studio through Dependency Graph.

  • Dependency Graph
  • Call Graph
  • Class Inheritance Graph
  • Coupling Graph
  • Path Graph
  • All Paths Graph
  • Cycle Graph

These various type of graphs are accessible from NDepend->Graph menu items.
clip_image013

clip_image014[6]

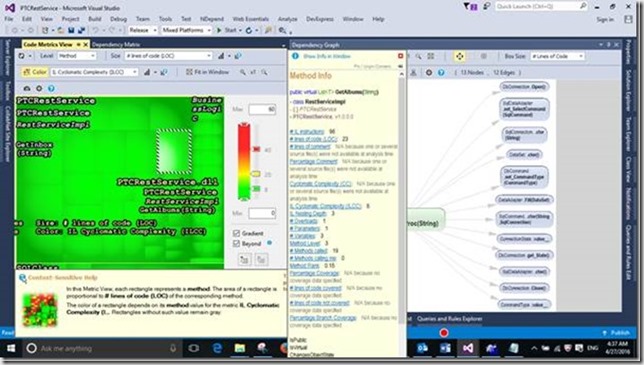
Code Metrics View

Code metrics view represents tree-structured data in rectangular blocks format.
clip_image015

Continuous Integration Reporting

These feature matter much analyzing a huge code base. Along with CQLinq, I like NDepend for this feature. NDepend integrate with TFS, Team city etc. in build process to check for the violation of CQLinq rules continuously and these are reported to the development teams to improve the code.

NDepend can analyze source code and .NET assemblies through NDepend.Console.exe. Each time it analyzes a code base, NDepend yields a report that can inform you about the status of our development. As I described in the starting of article about the html document which generated during the analyzing process is generated during build process.

This exe is located in the installation folder and the file name is “NDepend.Console.exe”. It is integrated in the building process by specifying command line arguments.

Conclusion

These are the few features which I have used so far but NDepend is loaded with lots features. In my opinion NDepend is light weight, powerful and intuitive application. Customization with the rules and metrics is an additional advantage using its best part CQLinq. It also integrate with Reflector and other tools which improves the productivity. I found it much better tool for maintaining quality of the application so far. Hope NDepend will continue improving this tool in future and let development process to improvise in easy way.

Task.WaitAll freezes UI with Control.Invoke() method.

Parallel tasks are important to complete the independent operation simultaneously. It makes us completely very heavy and time taking processes in less time when these operations run in multi-core environment but we have to follow the rules to make this multi-tasking to work.

Today I experienced such a case where my written code put me in a condition of “Dead Lock”. It is a situation more than one task that want to acquire the same resource and one is already holding this resource but another also wants to access it. If no task able to complete its operation then it creates a deadlock situation.

When we creating application, in some cases it may be possible to update the UI in various threads. E.g. Progress reporting. I found a case that let our application put into a situation which freezes the application. Let there was few tasks that are independent of each other but we need to merge the result all of these tasks with some required condition.

List<Task> tasks = new List<Task>();
//Create and start independent tasks
tasks.Add(Task.Factory.StartNew<List<string>>(() => CreateInitialData()));
tasks.Add(Task.Factory.StartNew<List<string>>(() => CreateValidationData()));
tasks.Add(Task.Factory.StartNew<List<string>>(() => CreateGUILookup()));

Now we need to complete these tasks to get the results so that we can merge it. To do this, the Task Parallel Library has Task.WaitAll method which takes array of task as a parameter. It waits until all the operations do not complete. In other words, it hold the UI and waits to complete all the tasks.

Task.WaitAll(tasks.ToArray());
//Merge result of all task on completion

In one of the thread, some subtask is done which make a call to the UI. It was working fine for a while until I made some changes. I was trying to get one property of the progress bar and it was accessed in an asynchronous way using the “BeginInvoke” method. It was a bug in the application which does not return the correct results so I replace it with the “Invoke” method.

“Control.Invoke()” method waits and returns the results immediately while BeginInvoke method is an asynchronous approach. It leaves control from the current statement without returning the values and we are not able to get returned results until we call AsynResult.EndInvoke().

//At some instance code by mistake try to access 
// the properties of the any control and made dead lock
// 
int progress = (int)this.Invoke((Func<int>)delegate 
{ return progressBar1.Value; });
System.Diagnostics.Debug.Write(progress);

Now what WaitAll does, it blocks until all tasks have finished. The tasks can't finish because Invoke will run its action on the UI thread, which is already blocked by WaitAll. It is creating deadlock because Invoke waits for the UI thread to unblock.

Complete example:

namespace ParallelWaitDeadLock
{
    public partial class Form1 : Form
    {
        public Form1()
        {
            InitializeComponent();
        }
 
        private void button1_Click(object sender, EventArgs e)
        {
            List<Task> tasks = new List<Task>();
            //Create and start indepenet tasks
            tasks.Add(Task.Factory.StartNew<List<string>>(() => CreateInitialData()));
            tasks.Add(Task.Factory.StartNew<List<string>>(() => CreateValidationData()));
            tasks.Add(Task.Factory.StartNew<List<string>>(() => CreateGUILookup()));
 
            Task.WaitAll(tasks.ToArray());
            //Merge result of all task on completion
       
        }
 
        private List<string> CreateInitialData()
        {
            //
            Task.Delay(1000);
            return new List<string>();
        }
 
        private List<string> CreateGUILookup()
        {
            //
            Task.Delay(1000);
            //At some instance code by mistake try to access 
            // the properties of the any control and made dead lock
            // 
            int progress = (int)this.Invoke((Func<int>)delegate 
            { return progressBar1.Value; });
            System.Diagnostics.Debug.Write(progress);
            return new List<string>();
        }
 
        private List<string> CreateValidationData()
        {
            //
            Task.Delay(1000);
            return new List<string>();
        }
    }
}

We need to take care to avoid such a situation when subtask tries to do UI relation operations even the parent task holds the UI and waits to complete the task.

It is causing a deadlock. The UI thread is waiting for the all tasks to be completed. UI resources are already locked by the Task.WaitAll and then we are trying to invoke code on the UI thread which is causing "Deadlock".

Task.WhenAll() method will return a new task that will be marked as completed when all tasks have completed. If we await this task, UI thread will be freed, and so the routine will be able to invoke code on the UI thread, avoiding a deadlock.

We should use Task.WhenAll() instead.  

await Task.WhenAll(tasks.ToArray());

How to create Node.js development environment in Visual Studio?

Now Visual studio is enriched with the tools that turn Visual Studio into a powerful Node.js development environment. Node.js Tools for Visual Studio is free and open source plug-in built on top of Visual Studio 2012, 2013, or 2015. This tool has enable following feature for Node.js development:

  • Intelligent code completion
  • Advanced debugging and profiling
  • Integration with other Visual Studio features and 3rd party tools
  • Node.js, io.js, JavaScript, Typescript, HTML, CSS, and JSON support

Installation:
To create Node.js development environment in Visual Studio follow the below steps:

  1. Install Visual Studio
    Node.js Tools for Visual Studio supports Visual Studio 2012 Update 4, Visual Studio 2013 Update 4 and higher. It also support community version of Visual Studio. Visual Studio Community is a free, fully featured, and extensible IDE for individual developers, open source projects, academic research, education, and small professional teams. Create applications for Windows, Android, and iOS as well as web applications and cloud services. Build apps for any platform. Use designers, editors, debuggers, and profilers in a single tool. Access thousands of extensions and more. Go to Visual Studio download page and download which flavor of Visual Studio application you want to use.
  2. Install Node.js Tools for Visual Studio
    Node.js Tools for Visual Studio installs via msi installer and takes few minutes. Just download the appropriate version of the tools according to the Visual studio that you have installed. The latest release of tools is Node.js Tools 1.1.1 and if you have installed Visual Studio 2012 or 2013 then download tools that relevant to your Visual Studio installation.
    clip_image002_thumb[2]
    After downloading the tools follow the installation wizard to complete the installation. Currently I am using Visual Studio 2013 so I am using tools compatible with Visual Studio 2013.

    clip_image003_thumb[1]
    Click next and then accept License agreement to complete the installation.
  3. Install Node.js and Get Started with Node Tools for VS
    in last step, we need to install Node.js interpreter and Azure tools (for deployment). Actually Node.js Tools for Visual Studio requires a Node.js interpreter to be installed to work with Node.js. Node.js is built for 32-bit and 64-bit architectures.
    Node.js (x86): https://nodejs.org/dist/v0.12.7/node-v0.12.7-x86.msi
    Node.js (x64): https://nodejs.org/dist/v0.12.7/x64/node-v0.12.7-x64.msi
    Azure Tools:
    Azure Tools for VS 2015: http://go.microsoft.com/fwlink/?LinkId=534216
    Azure Tools for VS 2013: http://go.microsoft.com/fwlink/p/?linkid=323510
    Azure Tools for VS 2012: http://go.microsoft.com/fwlink/p/?linkid=323511

Now we are ready to start working with Node.js in Visual Studio and going to see the installed temples for the Node.js projects.
To create a project, Select New Project from File menu. You will find Node.js templates in Installed Templates under JavaScript section. Click on Node.js and you will find several template to create Node.js projects.

clip_image005_thumb[2]

Select “Blank Node.js Web Application”. Enter a project name “NodejsWebAppTest” and location and click OK.

Once Visual Studio completes the process to create the project then it opens “server.js” file in the editor. It is just like a program which prints “Hello world” on the console.

var http = require('http');
var port = process.env.port || 1337;
http.createServer(function (req, res) {
    res.writeHead(200, { 'Content-Type': 'text/plain' });
    res.end('Hello World\n');
}).listen(port);

Now press F5 to run the application in browser. In my case what happened, I missed the step 3 – Installing Node.js. Due to this reason an Information dialog appear on my screen telling that you have not installed Node.js.
clip_image006_thumb[1]

Then I have to download Node.js and install it before running this application again. Here are the steps to install Node.js:

  1. Run the downloaded application and it will popup below welcome screen. Click Next.
    clip_image007_thumb[1]
  2. Accept License agreement to complete this step and then click Next.
    clip_image009_thumb[1]
  3. After this step it will ask you to specify the destination folder where it should be installed.
    clip_image011_thumb[1]
    This is global installation of Node.js which is referenced in the projects. We can specify the path to a local interpreter in each of your Node.js projects.
  4. After that click next and at last step, click install to start installation process.
    clip_image013_thumb[1]

When this process complete then again try to run the application. Just press F5 and you will see the results in the browser.

clip_image015_thumb[1]

Conclusion:
Now we have a Node.js development environment up and running in Visual Studio. There are lots features included in the IDE for development of Node.js as we are debugging a C# code. E.g. Debugging, IntelliSense, Profiling and Interactive windows also.